

What is a good ad agency profit margin?
A healthy ad agency profit margin falls between 15% and 20% net. High-performing agencies push into the 25–30% range, and elite shops with deep specialization reach 30–40%. Those benchmarks hold across agency sizes, but the spread between a 15% margin and a 35% margin traces back to structural differences in pricing, staffing, and delivery efficiency rather than revenue alone.
The US advertising agency industry generated $78.2 billion in revenue in 2025 according to IBISWorld, with an industry-wide profit margin of 20.7% and a compound annual growth rate of 3.6% over the preceding five years. That 20.7% is the macro average. Individual agencies fall anywhere from single digits to north of 35% depending on their specialization, pricing model, and how tightly they manage utilization and overhead.
Key Takeaways
The US advertising agency industry generated $78.2 billion in revenue in 2025 with an industry-wide profit margin of 20.7%. A healthy net margin for individual agencies falls between 15% and 20%, while high performers reach 25-30% and elite specialized shops hit 30-40%.
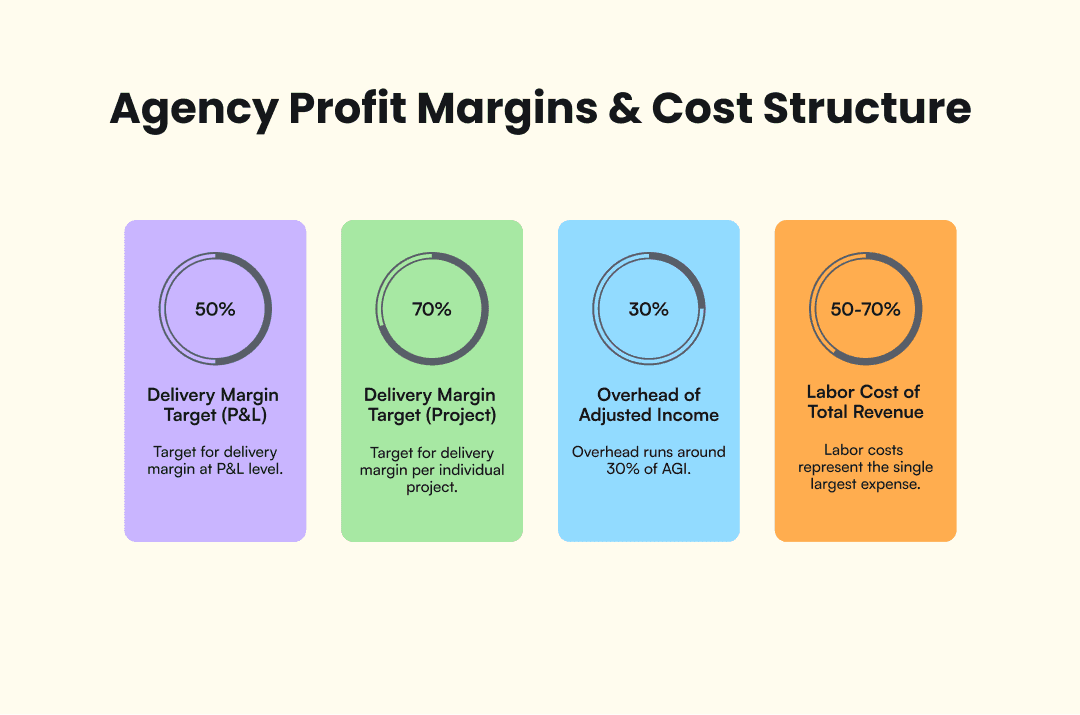
Labor costs consume 50-70% of total agency revenue, making them the single largest expense category. Overhead runs around 30% of adjusted gross income (AGI).
Utilization rate is the highest-impact margin lever for most agencies. The target range is 65-80% billable hours, and a 10% improvement on the same team can add roughly $100,000 in annual profit.
Digital agencies carry the strongest margin profile among agency types, averaging 20% net with top performers reaching 30-40%. The US digital agency market sits at $58.2 billion and is growing at 13.6% CAGR, roughly 3-4x faster than the traditional agency industry.
Unmanaged scope creep costs agencies 5-15% of their margins by inflating delivery costs, dragging down utilization, and compressing net profit on projects that looked profitable at the proposal stage.
AI tools are opening a new margin expansion path. Early adopters report 5-10% gains through fewer production hours per deliverable at the same or higher billing rates.
Agency owners track three distinct margin types. Confusing them is one of the quickest ways to misread your financial position.
Margin type | What it measures | Benchmark target |
Net profit margin | Bottom-line profitability after all expenses | 15–20% (healthy), 25–30%+ (high-performing) |
Gross profit margin | Revenue minus direct costs, before overhead | 50%+ |
Delivery margin | AGI minus delivery costs per project | 50%+ on P&L, 70%+ per project |
Net profit margin is what most agency owners reference when benchmarking against peers: the bottom line after every expense has been paid. Gross profit margin captures what you retain after direct project costs but before overhead takes its share.
Delivery margin is the most operationally useful of the three. It measures how efficiently your team converts billable hours into revenue per engagement. Delivery margin targets sit at 50% or above at the P&L level and 70% or above per individual project.
Operating margin sometimes appears alongside these three in agency financial reports. It includes overhead but excludes non-operating items like interest and taxes. For most agency owners benchmarking against peers, net profit margin is the more practical metric.
Two structural cost blocks set every agency’s margin floor. Overhead typically runs around 30% of adjusted gross income (AGI), based on agency benchmarking data from Parakeeto. Labor costs consume 50–70% of total revenue and represent the single largest expense for most agencies. Pass-through costs like media spend and third-party vendor fees get excluded from AGI, which is why gross margin in isolation can mislead. An agency billing $2M with $800K in media pass-throughs has different unit economics than one billing $2M in pure service revenue.
How wide these margins stretch depends on agency type and specialization.

How profit margins differ by agency type
Margin ranges shift based on what an agency does and how narrowly it focuses. The table below maps net profit margin ranges, primary margin drivers, and context across four common agency models.
Agency type | Net margin range | Primary margin driver | Notes |
Digital agency | 15–25% | Lower overhead, scalable deliverables | IBISWorld: $58.2B US market, 13.6% CAGR (2025). Toggl: average nets ~20%, top performers 30–40%. |
Creative agency | 12–22% | Premium pricing on talent-driven work | High labor costs offset by higher per-project fees. Margins depend on talent model (in-house vs. freelance). |
Full-service agency | 10–20% | Broad revenue base | Multiple service lines increase overhead. Margins compressed by the cost of supporting breadth. |
Small / boutique | 10–30%+ | Low overhead, owner involvement | Wide range. Without a niche, pricing power drops and margins cluster toward the lower end. |
Digital agencies benefit from lower overhead and deliverables that scale without proportional labor increases. Toggl's benchmarks place the average digital agency net margin around 20%, with top performers reaching 30–40%. IBISWorld data puts the US digital agency market at $58.2 billion, growing at a 13.6% CAGR, roughly 3–4x faster than the traditional agency industry.
Creative agency margins are more volatile because the work depends heavily on senior talent. An agency billing $30,000 per brand campaign can still net only 12–15% if two senior creatives spend three weeks on it. The upside comes when creative agencies build repeatable processes around their talent or shift to subscription models for ongoing brand work.
Full-service agencies carry the broadest revenue base but also the heaviest overhead. Supporting strategy, creative, media, and analytics under one roof requires larger teams and more management layers. Margins typically land between 10% and 20%, with the lower end more common among mid-sized agencies that haven't reached the revenue scale to absorb their fixed costs.
Four operational levers determine where your agency lands within the benchmark ranges. Getting even one of them right can shift net margins by several percentage points.
Utilization rate is the single highest-impact improvement for most agencies. The target range is 65–80% billable utilization. Below 65% and your team is spending too many hours on non-billable work. Above 80% and you risk burnout with no capacity for business development or training. Scoro estimates that a 10% increase in billable utilization on the same team can translate to roughly $100,000 in extra annual profit, though the figure varies with team size and billing rates.
Overhead management defines the ceiling on net margins. The benchmark is overhead at or below 30% of AGI. Agencies running above that threshold compress net profitability regardless of how fast revenue grows. Office costs, admin staff, software subscriptions, and non-billable management time all sit in this bucket, and each one tends to creep upward without active monitoring.
Pricing model shapes both margin predictability and the upper bound on what you can earn per project.
Pricing model | Margin predictability | Margin ceiling | Best for |
Retainer | High | High | Recurring client relationships |
Project-based | Moderate | Moderate | Defined-scope engagements |
Hourly billing | Low | Low | Early-stage agencies, overflow work |
Value-based | Low (variable) | Highest | Agencies with strong positioning and measurable outcomes |
Retainer models produce the most predictable margin profile because revenue recurs and delivery can be planned against capacity. Project-based pricing works for defined scopes but carries margin risk when scope changes mid-engagement. Hourly billing has the lowest margin ceiling because it ties revenue directly to hours worked, capping growth at headcount. Value-based pricing offers the highest ceiling but is hardest to implement, though agencies that make the shift can push margins well beyond the 20% baseline.
Labor costs sit at 50–70% of revenue, which makes them the lever with the most room to move. Improving labor-driven margins comes through better utilization rather than fewer people, selective use of freelancers and contractors for variable capacity, and AI-assisted delivery to reduce hours per deliverable.
Scope creep: the silent margin killer
Scope creep erodes agency profitability from every direction. Unmanaged scope creep can cost agencies 5–15% of their margins, a range that matches what agency operators consistently describe.
The damage hits all three margin types. Extra revision rounds inflate delivery costs and hurt delivery margin. Unbillable hours on out-of-scope requests drag utilization down. And the combined effect compresses net profit on projects that looked strong at the proposal stage. Treating scope management as a margin protection practice, not just a project management task, is one of the simplest ways to protect the profitability you already have.
How AI is changing agency margins
AI tools are creating a new margin expansion path for agencies that integrate them into production and delivery workflows. The mechanism is straightforward: fewer billable hours consumed per deliverable at the same or higher billing rates means more profit per project. Early adopters report 5–10% margin expansion as a realistic target.
The margin impact concentrates in four areas:
Creative production: AI-generated video ads, image variations, and ad copy cut delivery time from days to minutes for initial drafts. Platforms like AdMove handle creative strategy, scripting, and video production from a single product URL, reducing per-asset cost for agencies managing multiple client accounts.
Reporting and analytics: Automated performance dashboards free analyst hours for strategy work that clients pay a premium for.
Media buying: AI bid management and budget allocation reduce wasted spend and improve ROAS without additional headcount.
Creative testing: Running 10–20 ad variations per week instead of 2–3 speeds up learning and strengthens campaign performance over time.